

A road trip to financial freedom
How much is enough? Take some of the pressure off.
By Lizelle Steyn
15 August 2019

I promise this will be my last post on the 4% rule or rule of 300 - for a while. Well, this one is actually not about the 4% rule but about alternative ways to calculate your financial freedom magic number. Because getting your investments to 300 times your monthly expenses is kind of a tall order and maybe some of you are feeling somewhat 'flat tyres' after reading the previous two posts. Are there perhaps other formulas that could work better for you?
Before we start looking at alternatives, remember the 4% rule assumes that:
- you want to be in a position where you never have to work again; and
- ideally you want your 'retirement pot' to last forever.
Those are two extreme requirements, particularly the last one - needing to have all your capital intact when you die. That means that effectively, if you want to, you can leave your lucky heir the gift of financial freedom (ignoring estate duty for the moment.) Wow, you are quite an overachiever, aren’t you? Maybe you want to take some of that pressure off yourself and I'm going to do that by loosening up those two requirements a bit.
Your financial freedom plan is looking much better if you can keep on working
What happens when financial freedom means you want to keep on working, just not as hard as you’re doing right now, or you want to do work that’s close to your heart, but doesn’t pay as well? Suddenly - with fresh income streaming in every month - your financial future looks a lot better.
Use the 4% rule to cover your basic needs. Your active income pays for luxuries.
If you can keep on earning an active income indefinitely, using the 4% rule, also known as the rule of 300, you need to save up 300 times your very basic monthly expenses only (no frills). Your financial freedom savings pot will then provide you with a passive investment income to cover your basic needs. Just in case something happens to your health, or your job, or clients, so you’ll always have food, medical aid, and a roof over your head. Non-essentials (frills) like overseas holidays, local road trips, nice clothes, dining out and all sorts of entertainment need to be funded by you actively earning an income. For many people that’s as financially free as life is every going to be – and that’s damn fine.
Plan your future income stream. Then draw your whale graph.
As mentioned before, the 4% rule is a rule of thumb. To plot out a more precise financial future, see if you can find someone to draw up what some financial planners call a ‘whale graph’ - a picture of how your portfolio initially grows and then tapers off later in your life when your drawdown rate is bigger than the rate at which your portfolio can replenish itself. Below is an example.
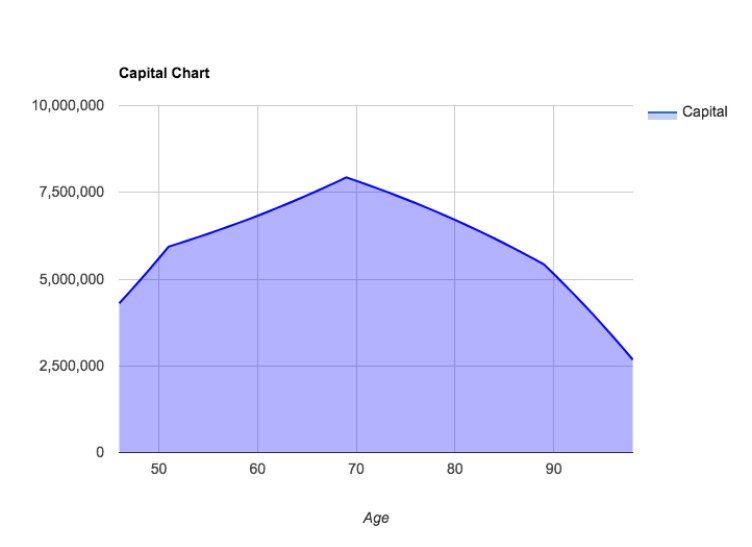
A friend of mine who subscribes to Pete Matthew's EnvisionYourMoney, showed me this whale graph for someone who is 46 years old – let’s call him Michael. Michael has saved up R4 million and needs R400 000 per year to maintain his lifestyle. While he’s earning more than he needs, his capital is growing rapidly. But from age 52 he wants to scale down his work and stop saving for old age. Notice how his capital is still growing in this phase, but slower than when he kept on adding to it. From age 70 he wants to scale down further and work only two days a week. In this stage his capital starts decreasing, because he will be drawing from it to supplement his active income and maintain his lifestyle. And then after age 90 Michael plans to no longer work, drawing the full R400 000 per year from his portfolio, causing his capital to shrink even faster, but still leaving him with more than enough at age 99.
You can’t take it with you. Just make sure you’re OK for the rest of your life.
In the whale graph example above, Michael made peace with the fact that his capital will have to decrease at some point if he wants to stop working but still maintain his lifestyle. Most top advisers should have access to similar software and charts to help you with these illustrations, but if you’re a DIY investor and can’t find someone to take you through the whale graph exercise, how do you know how much to draw from your investments if you want it to last only for your lifetime?
Know the industry drawdown guidelines
The body through which the local investments industry regulates itself is called Asisa. (This is in addition to the regulation by the external watchdog, the FSCA.) Asisa has run the calcs and came up with the following drawdown guidelines.
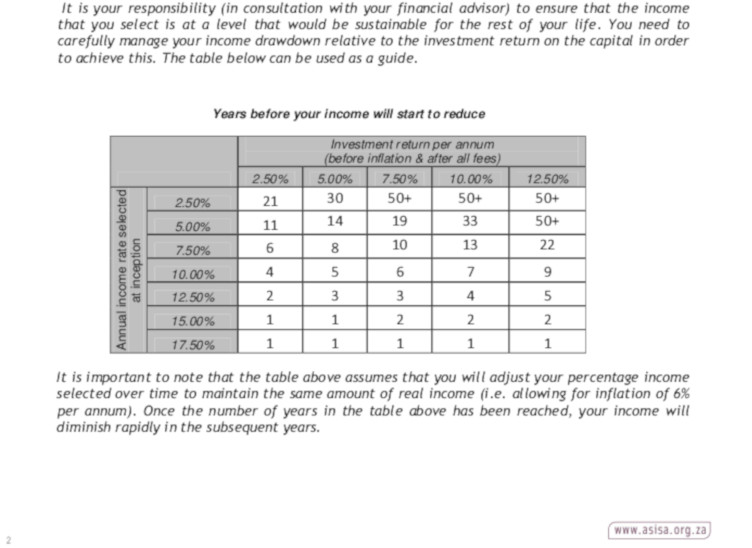
You can ignore the 2.5% and 5% column. I know returns have been terrible lately, but that’s an exception. Over the long term, on average over the rest of your life you should not be getting returns this low. On the other end of the spectrum, the 12.5% column is maybe too optimistic, and I would ignore that one too. Let's rather be conservative with our return expectations. With inflation under control for several years now and no hint that it might spiral out to +6% levels soon, between 7.5% and 10% per year on average is a more realistic return for a balanced and well diversified portfolio. But how do you practically apply the 7.5% or 10% column to your drawdown strategy?
Let's use the 10% return column as an example. If you withdrew 10% of your portfolio value to start off with and that portfolio returns 10% per year on average, it would take only seven years before the income you draw can no longer keep up with inflation and start to rapidly decrease in value every year. On the other hand, if you started off by withdrawing 5%, it would take 33 years before you start running into trouble. But if you withdrew only 2.5%, you’d be able to maintain that income and increase it by inflation every year for more than five decades (most likely forever).
How does this take the pressure off? Well, if you expect to live until well into your nineties, in your sixties you can start drawing an income of 5% of your portfolio per year instead of the Rule of 300’s 4%. And that amount can increase by inflation every year and you will still be OK. Which means you would only need 240 times your monthly expenses in your portfolio in your 60s instead of 300.
The FSCA guidelines show women need to plan differently from men
It's worth mentioning that the FSCA also came up with recommended drawdown guidelines recently and they recommend that a male retiring at age 55 draw no more than 4.5% per year; a female should draw no more than 4% (a woman lives longer than a man on average and needs to be more careful not to run out of money during her lifetime). When retiring at age 65, this percentage increases to 5.5% for a man and 5% for a woman. A 5.5% dawdown rate means you would only need 218.1818 times your monthly expenses if you're a man retiring at age 65. This is starting to look possible...
Personally, I still want to be in a position to 'retire' by age 55, but clearly there are benefits to staying in the workforce a bit longer: not only do you have more time to save up a bigger amount, you can also cut yourself some slack and withdraw more than 4% if your budget is feeling a bit tight. Like humans, budgets need some space to breathe.
Use an online retirement calculator
If you can live with the idea of working up to age 55 or even longer, you can play around with the age at which you can afford to stop working by using one of the many free online calculators offered by investment companies such as 10x. 10x sets age 65 as your default retirement age but you can adjust this down to age 55. 10x further assumes that from that chosen age you'll hand over all your money to a life insurer that will pay you a guaranteed income for the rest of your life (no need for you to guess your departure date).
Time to chuck the calculator
And then there's the number one strategy for taking the pressure off anyone trying to squirrel away 300 times their monthly expenses. Spend more time figuring out how to create the kind of work you want to do forever and get a lifetime income from, than the time you spend worrying about how to get to the financial freedom magic number and about how much is enough. Until I've got that one figured out, my foot is on the pedal, heading for my annual savings goal. Some years I make it; some years I don't. But I keep on driving.