

A road trip to financial freedom
Forget fees. It’s asset allocation that drives portfolio performance
By Lizelle Steyn
5 January 2021

Over the past few years, with investors taking a greater interest in the detail of their portfolios, investment fees have moved into the spotlight and high-fee funds are increasingly being shunned. While being fee-sensitive is generally a good thing, I’m seeing a worrying trend arise at the same time: the obsession with low fees is crowding out the most important decision investors need to make – asset allocation (picking the funds with the most appropriate asset classes and geography for your portfolio).
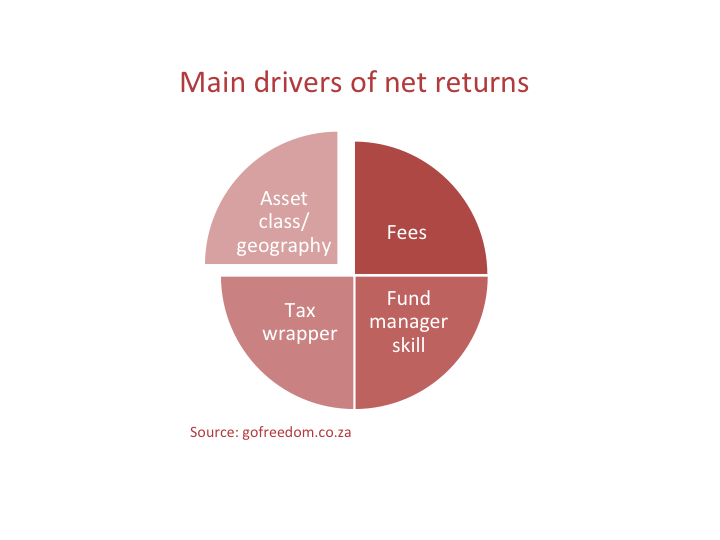
Of the four drivers of portfolio performance, asset allocation is the most powerful
Before zooming in on asset allocation, let’s briefly discuss the four main drivers of your net portfolio performance, and by 'net' I mean the amount you will have in your pocket one day after all fees and taxes have been paid:
- Asset allocation
- Investment fees
- Tax wrapper
- Fund manager skill/luck
The last three drivers of portfolio performance listed above are all important – each for its own reasons.
Investment fees
Investment fees can only be reduced not avoided. Even if you invest in an index-tracking fund like an exchange-traded fund (ETF), you still need to pay fees to cover the expenses of the company tracking the index on your behalf and also fees to the trading platform. As mentioned in a 2020 post on investment fees, the Satrix40 ETF is currently the cheapest fund in the country at a total investment cost of 0.14% (plus the trading platform fees of whichever platform you choose). Then there are actively managed funds charging more than 2% per year and a whole spectrum of fees in-between those two figures. With similar funds, for example when comparing two money market funds or two index-tracking funds, it makes sense to go for the one with the lowest fees. With actively managed funds, especially balanced funds, the manager with the lowest fee doesn’t necessarily give the best investment return over the long term. If it’s a skilled manager getting his or her asset allocation right, a higher fee could still lead to a higher net investment return than a low-fee less skilled manager.
Tax wrapper
A tax wrapper is a product that makes it possible for you to pay either no tax on your funds, for example when they are inside a tax-free savings account, or to delay paying tax, of which a retirement annuity (RA) is an example. Whether you wrap your funds in one of these, or not, could make a huge difference to your portfolio performance over a decade or two – especially after considering the capital gains tax when you withdraw your money one day.
Fund manager skill
Fund manager skill is the value that a fund manager adds on top of the performance that the index gave, by leaving out/’weighing down’ certain shares and by bulking up other shares to a much bigger percentage than how they appear in the index. In other words, within the context of portfolio performance, fund manager skill is the portion of your investment return that exceeds the investment return of the index, and the result of how a manager positions the portfolio to look different from the index.
Having briefly touched on the 3 'lesser' drivers of portfolio performance, we can move on to the biggest driver - asset allocation.
What is asset allocation and the main asset classes?
Asset allocation describes which asset class and geography you choose for your overall portfolio. In other words, how much of your money do you allocate to each of the following five asset classes:
- Listed equity (shares in companies listed on a stock exchange)
- Listed property (shares in real estate companies or investment trusts)
- Interest-bearing assets (also called fixed income or bonds)
- Cash (also called money market)
- Alternative assets (commodities like gold, hedge funds, private equity and real assets)
The first four asset classes – equity, property, bonds and cash – are the traditional/ mainstream asset classes. The items in the last grouping are called the alternatives and include niche investments requiring more specialised skill sets.
The first two asset classes – equity and property – are the high-growth asset classes, but they come with more volatile ups and downs in the market than the more conservative asset classes of bonds and cash. The alternative asset class is hugely varied – from very conservative cash-like hedge funds to the most volatile, high-risk assets you may ever encounter like cryptocurrencies.
Also related to the topic of asset allocation is how you split your portfolio between local and offshore assets, something which I will focus on in a separate article.
Asset allocation example – SA property vs SA bonds in 2020
The past year has been a good example of how different your portfolio performance can be from a fellow investor’s, depending on your respective asset allocation. Let’s take the asset class SA property, for example. If you allocated 100% of your portfolio to this asset class at the start of 2020, you would have ended up with a portfolio performance of -34% for the year. If your friend chose SA bonds, he would have shown an investment return of 9% in 2020. Put differently, if you both invested R100 000, you would have been left with only R66 000; your friend with R109 000 – almost double your portfolio size. Even if he was paying exorbitant fees, with an asset allocation choice like this, your low-fee portfolio would never have been able to keep up with his portfolio performance.
Or say you allocated all of your portfolio to international developed market equity via the MSCI World. Your investment return in 2020 would have been 22% (calculated in SA rand), while your friend who allocated everything to SA equity, thinking that this asset class showed value at the start of the year, made 7%. Within one year, asset allocation leads to huge variance in investment returns.
Here's an example of the investment return of different asset classes over the past individual calendar years since 2008 up to September 2020. (Unlike the figures quoted for 2020 above, the chart below has only been updated for the first 9 months of 2020.)
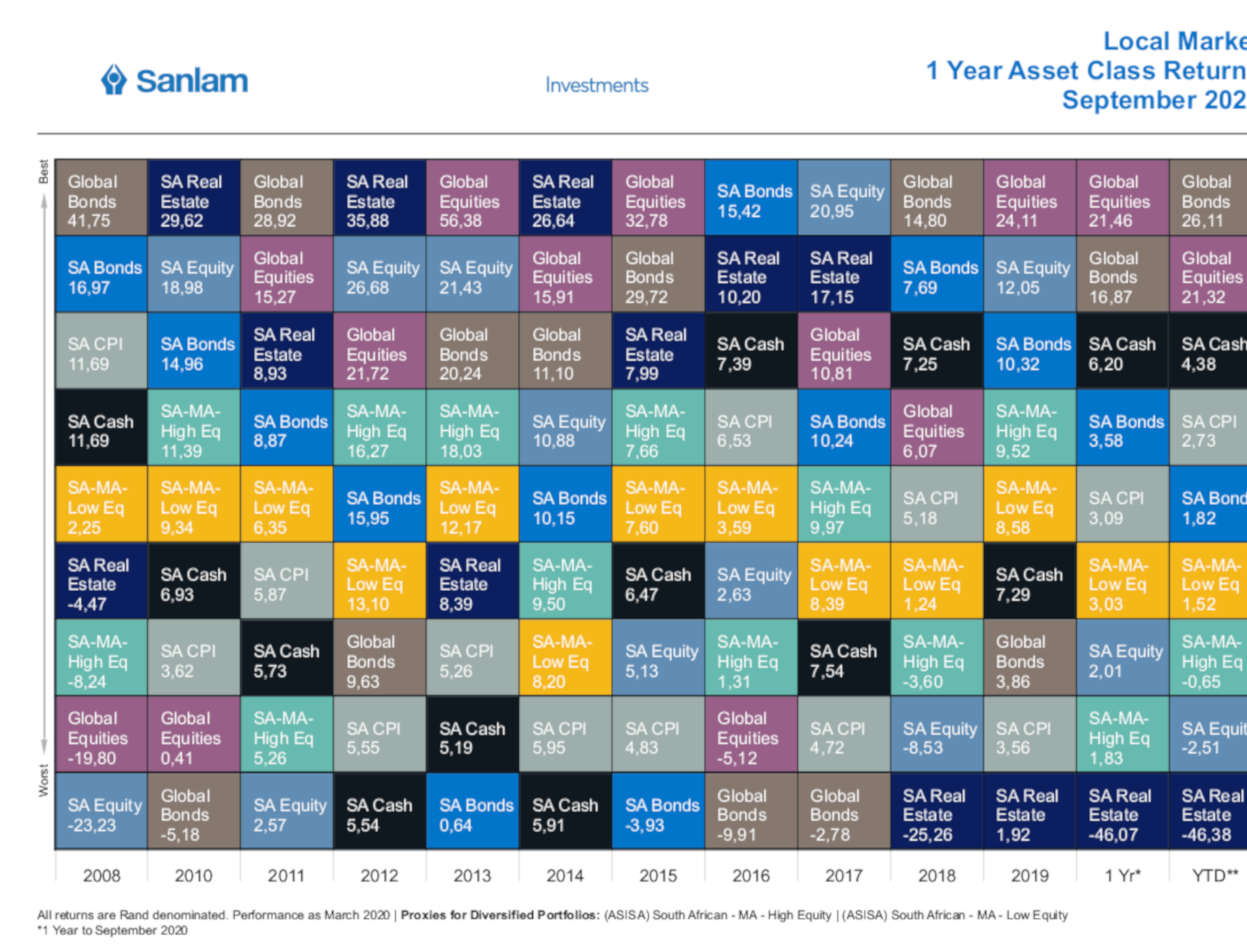
The above asset class chart is what’s called the ‘smartie box’ of asset class returns in the industry. The chart shows that, on a calendar-year-by-calendar-year basis, asset allocation is an enormous driver of portfolio performance – or the lack thereof.
For buy-and-hold long-term investors, it’s long-term asset allocation that counts
However, for long-term investors, returns based on one year only is immaterial. Long-term investors don’t attempt to time the market and predict next year’s top performing asset class (that’s impossible to get right consistently, even for the most experienced experts). When you’re in it for the long haul, all that matters is the long-term investment return of asset classes. Fortunately, we have good data at hand for this.
In the seminal investment book Triumph of the Optimists, the authors looked at more than 100 years of data across different countries and found that the long-term average investment return per traditional asset class is actually very similar for different countries.
| Asset class | Long-term investment return (averge p.a.) |
|---|---|
| Equity | Inflation + 6-7% |
| Property | Inflation + 5-6% |
| Bonds | Inflation + 2% |
| Cash | Inflation + 1% |
Important: Investors can’t get the above index returns. There are always fees, even with index tracking, and fees still need to come off the above index return figures. The average investor’s return experience would therefore be slightly lower than the figures in the table above. And peformance doesn't come in a straight line - as the 'smartie box' earlier showed. Some years are excellent, some mediocre and others plain pathetic.
If equity is the best performer, why not allocate your entire portfolio to equity?
So, if equity has proven itself as the asset class with the highest return over more than 100 years, why not allocate your entire portfolio to it?
Two reasons:
- it may take longer for equity to outperform other classes than you have time
- you may not have the stomach for the bumpy or just plain slow ride towards long-term outperformance
Even if you have a five-year investment horizon, equity might lag the other asset classes. Have a look at the past five years’ investment returns for each of our local asset classes:
| Asset class | Investment return over 5 years to end 2020 |
|---|---|
| SA equity | +6% p.a. |
| SA property | -8% p.a. |
| SA bonds | +10% p.a. |
| SA cash | +7% p.a. |
The so-called ‘growth’ assets – equity and property – lagged bonds and cash dramatically, even over an investment period as long as five years. This is partly why it’s not a great idea to allocate 100% of your portfolio to equity if you’re investing for shorter than 10 years. The other reason relates to your risk profile and risk appetite.
There’s the risk you can afford to take and then there’s the risk you’re willing to take
If you’re investing for 30 or 40 years, you can afford to allocate all of your portfolio to the two high-growth asset classes – equity and property. Just don’t look at your portfolio value again once you’re invested, until 30 years later. The problem is we’re all human: we check our portfolios at least once a year and we compare it either to our friends’ portfolios or to what we could have gotten in the money market (cash).
Let’s have a look again at the worst calendar-year investment returns, as mentioned in the ‘smartie box’ of asset class returns earlier.
| Asset class | Worst calendar year performance since 2008 |
|---|---|
| SA equity | -23% (in 2008) |
| SA property | -34% (2020) |
| SA bonds | -4% (2015) |
| SA cash | +5% (2020) |
One needs a very strong stomach to stay invested when you lost 30% or 40% in one year. (Here’s a reminder of what to do and not to do during a market crash.) Sometimes it’s not extreme capital losses that drive investors out of an investment, but returns that are going nowhere slowly – like our local stock market hovering close to 0% in 2011, 2015, 2016, and 2018. What I see too often is friends and family withdrawing their long-term investment when they get a return lower than cash, even if it was a positive year. It seems not even negative investment returns motivate investors to jump ship as much as seeing only 1% or 2% growth in their portfolios in any one year.
New investors generally have little tolerance for any calendar year return lower than what they would have received if they left their money in cash. Often the risk we’re willing to take is significantly lower than the risk we’re able to take. In practice, even though it might be the most logical choice, choosing funds with 100% allocated to equity doesn’t work for the majority of humans new to investing, despite the fact that equity would have given the best portfolio performance over the very long term.
Ultimately, the fine art of high-performance investing is to get the right blend between equity, property, bonds, cash – and even some alternatives in your portfolio to end up with high enough investment returns for the amount of risk you are willing to take. And to keep on nudging yourself towards the higher risk asset classes – equity and property – if you’re investing for 10 years or more. And then, to stay invested even when it feels like the bottom has fallen out of the market or when some years you’re getting a pedestrian return of only 1% or 2%.
Strong long-term performance is not possible without several terrible or pedestrian one-year periods.
How do you practically implement the right asset allocation for your portfolio?
Fortunately, there are online risk profilers and other resources to guide you towards the amount of risk you can persoanlly take on and then show you how your risk profile translates to asset allocation and ultimately the funds – ETFs or unit trusts – that would be appropriate choices. More on that in my next post.